BCG research confirms that 70% of CMOs are accelerating AI investment in 2026, yet most are still measuring those initiatives with last-click attribution models and pipeline-velocity dashboards built for a pre-AI world.
The CMO’s guide to AI metrics answers one urgent question: which KPIs actually matter when both your internal GTM stack and your buyers’ discovery journeys have been fundamentally restructured by AI?
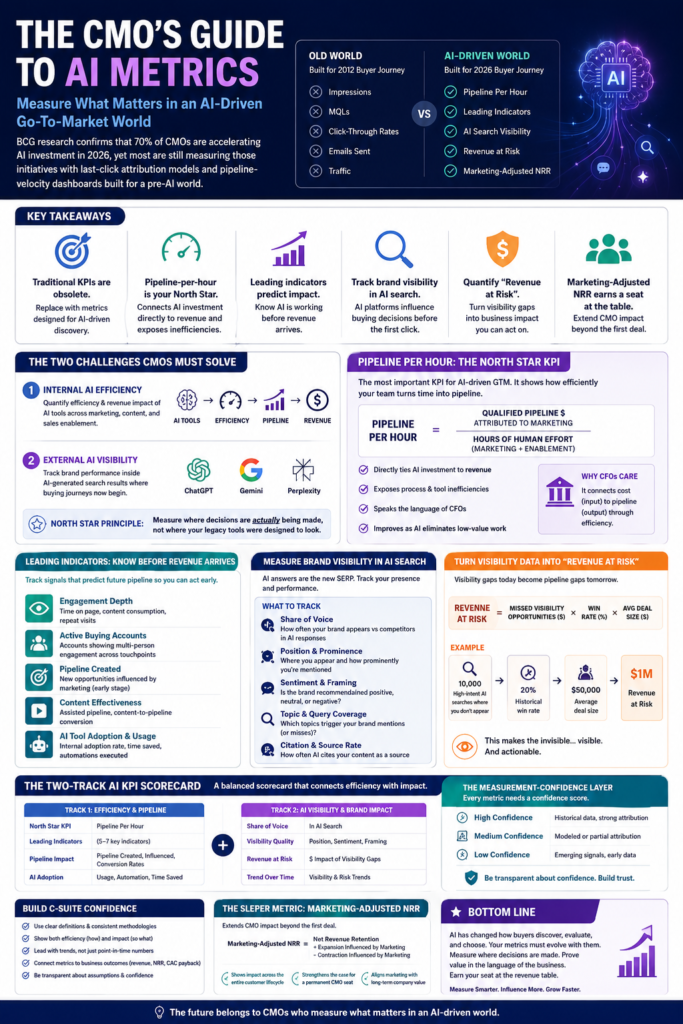
Table of Contents
- Why Your Current Marketing Dashboard Is Already Obsolete
- What Is the Right North Star KPI for an AI-Driven GTM Motion?
- Pipeline Per Marketing Hour: The AI Efficiency Metric CFOs Actually Respect
- Which Leading Indicators Tell You If AI Is Actually Working Before Revenue Arrives?
- How Should CMOs Measure Brand Visibility Inside AI Search Results?
- How to Turn AI Visibility Data Into a “Revenue at Risk” Number
- What Does a Two-Track AI KPI Scorecard Actually Look Like?
- The Measurement-Confidence Layer
- How Do You Build C-Suite Confidence in AI Metrics When Attribution Is Noisy?
- The One CMO Metric Hiding in Plain Sight: Marketing-Adjusted NRR
- Frequently Asked Questions
- What metrics should I track to measure AI’s impact on marketing?
- What are the KPIs used to evaluate AI performance in marketing?
- How is AI changing the way CMOs measure marketing success?
- What is a good North Star KPI for AI-driven marketing?
- How do you measure brand visibility in AI search results like ChatGPT or Google Gemini?
- Why is Net Revenue Retention (NRR) relevant to the CMO role?
- How do you present AI marketing metrics to a skeptical CFO or CEO?
- Conclusion
The challenge is not one measurement problem. It is two. First, CMOs must quantify the efficiency and revenue impact of AI tools deployed internally across demand generation, content, and sales enablement. Second, and far less understood, they must track brand performance inside AI-generated search results, where ChatGPT, Gemini, and Perplexity are now shaping purchase intent before a single click ever registers on your dashboard.
This guide delivers a practical, two-layer KPI framework built around a single North Star principle: measure where decisions are actually being made, not where your legacy tools were designed to look.
TL;DR: The CMO’s Guide to AI Metrics reveals why traditional dashboards built around impressions, MQLs, and click-through rates are no longer sufficient for AI-driven go-to-market strategies in 2026. The article argues that pipeline-per-hour-of-human-effort should serve as the primary North Star KPI, connecting every AI investment directly to revenue while exposing inefficiencies in legacy workflows. CMOs are urged to adopt a two-track scorecard that pairs leading indicators with brand visibility inside AI search results, a channel most marketing dashboards currently cannot measure. Ultimately, Marketing-Adjusted Net Revenue Retention emerges as the sleeper metric that earns CMOs a permanent seat at the revenue table.
Key Takeaways
- Traditional KPIs like impressions, MQLs, and click-through rates were built for a 2012 buyer journey and are now obsolete, requiring CMOs to replace them with metrics designed for AI-driven discovery.
- Pipeline-per-hour-of-human-effort should be your North Star KPI, as it directly connects AI investment to revenue by measuring how efficiently your team generates pipeline output relative to time spent.
- Because revenue lags marketing activity by weeks or months, CMOs need leading indicators that signal whether AI is working before closed-won data arrives, so decisions are not always made in retrospect.
- Brand visibility inside AI search results (such as ChatGPT and Perplexity) is a critical unmeasured channel, and CMOs should build a dedicated tracking approach for how often and how favorably their brand appears in AI-generated vendor recommendations.
- A two-track AI KPI scorecard combining a Revenue at Risk calculation with pipeline efficiency metrics gives CMOs a defensible, structured framework for presenting AI performance to the C-suite.
- Marketing-Adjusted NRR is an underused metric that extends CMO ownership beyond the first deal, making it one of the strongest arguments for a permanent CMO seat at the revenue table.
Why Your Current Marketing Dashboard Is Already Obsolete
The marketing metrics most CMOs review every Monday morning were designed for a 2012 buyer journey. Impressions, MQLs, click-through rates, emails sent: these KPIs assume buyers discover brands by clicking links. They no longer do.
Google’s AI Overviews now appear in roughly 47% of all searches, according to BrightEdge’s 2026 AI Search Impact Report, and organic click-through rates have dropped by as much as 34% for informational queries where AI-generated answers appear above results. ChatGPT and Perplexity intercept millions of research sessions daily, answering buyer questions without ever sending a referral click. Your traffic dashboard will show a decline. Your pipeline may not reflect why.
The internal side of this problem is equally urgent. Marketing teams deploying AI agents for marketing automation are frequently measured on activity: content pieces published per week, email sequences triggered, ad variations tested. These are vanity metrics dressed up as productivity. They tell you how busy the machine is, not whether it is building a business.
Important: Vanity metrics (traffic, open rates, follower counts) feel good in a board slide but have near-zero correlation with pipeline contribution, CAC payback period, or net revenue retention. Those are the value metrics that determine whether marketing has a seat at the CFO’s table.
This is precisely the question every CMO should be asking right now: What metrics should I track to measure AI’s impact? The honest answer is that no single KPI covers both dimensions. You need one track measuring how your brand performs inside AI-generated answers (visibility without clicks), and a second track measuring whether your AI-powered workflows are producing revenue outcomes, not just outputs. Understanding how AI search differs from traditional SEO is the prerequisite for building either track correctly.
The rest of this article builds exactly that two-track scorecard.
What Is the Right North Star KPI for an AI-Driven GTM Motion?
A North Star KPI is a single primary outcome metric that connects every AI investment directly to revenue, anchored by a small set of leading indicators. For CMOs building an AI-driven GTM motion, choosing one is not optional: it is the difference between a defensible board presentation and a dashboard that generates questions no one can answer.
According to Gartner’s 2024 CMO Spend Survey, marketing leaders who tie budget decisions to revenue-linked metrics are significantly more likely to defend and grow their budgets year-over-year. The shift toward hard revenue accountability is no longer a best practice; it is table stakes.
The three most common North Star candidates for CMOs in an AI-driven GTM motion are:
- Pipeline per Marketing Dollar: Total pipeline generated divided by total marketing spend. Measures capital efficiency of AI-augmented demand gen. Best for CMOs under pressure to justify AI tooling costs to a CFO.
- Pipeline per Marketing Hour: Total pipeline generated divided by total marketing labor hours. Uniquely surfaces AI automation ROI in terms of human capacity freed. (Defined in detail below.)
- Net Revenue Retention (NRR): For CMOs who own post-sale expansion and upsell. NRR above 100% signals that marketing’s influence extends beyond acquisition, into retention-driven compounding growth.
Picking one matters because AI-generated attribution noise in AI search makes multi-metric dashboards easy to game and nearly impossible to defend when a board member asks which number actually matters.
Note: CAC and CAC payback period remain the most common secondary metrics paired with any North Star. A CAC payback period under 12 months is a widely accepted efficiency benchmark in B2B SaaS, according to OpenView’s 2024 SaaS Benchmarks Report.
Pipeline Per Marketing Hour: The AI Efficiency Metric CFOs Actually Respect
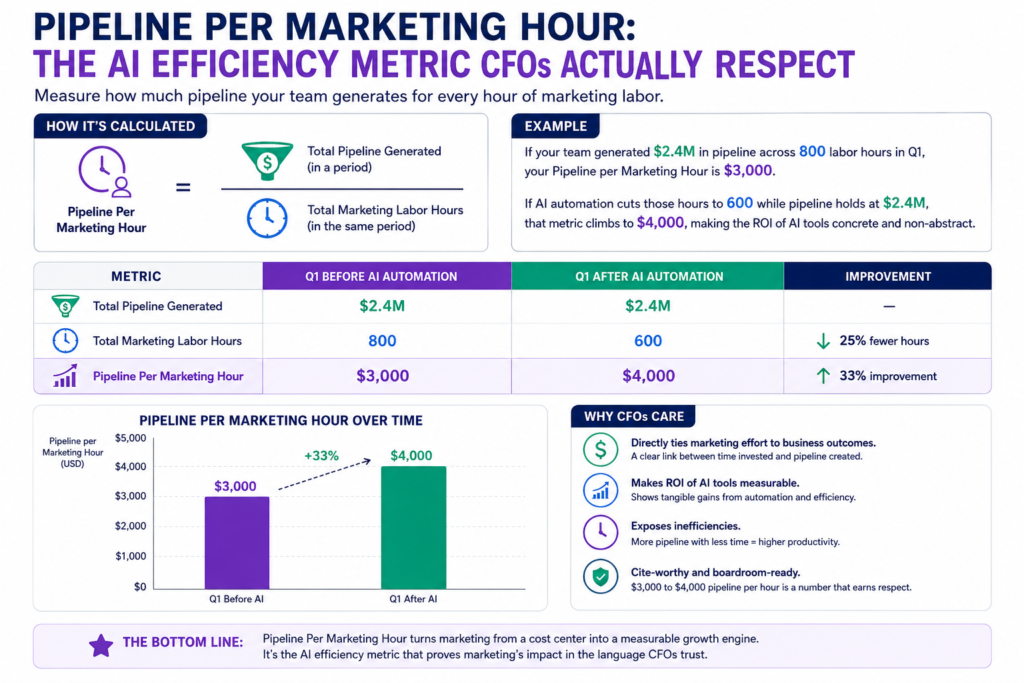
Pipeline per Marketing Hour is calculated as: total pipeline generated in a period divided by total marketing labor hours in that same period.
A simple example: if your team generated $2.4M in pipeline across 800 labor hours in Q1, your Pipeline per Marketing Hour is $3,000. If AI automation cuts those hours to 600 while pipeline holds at $2.4M, that metric climbs to $4,000, making the ROI of AI tools concrete and non-abstract.
This metric does not appear in legacy CMO dashboards, which is exactly what makes it a differentiator. When a CFO asks whether AI is paying off, “$3,000 to $4,000 pipeline per hour” is a cite-worthy answer. “We improved workflow efficiency” is not.
Pro Tip: Track Pipeline per Marketing Hour quarterly alongside your North Star to show the compounding effect of AI adoption on team capacity, not just output volume.
The clearest signal that AI is working is not that your team is producing more content — it is that each hour of human effort is generating more pipeline than it did the previous quarter.
Which Leading Indicators Tell You If AI Is Actually Working Before Revenue Arrives?
Pipeline-per-hour-of-human-effort is your North Star, but it reports late. Revenue lags marketing activity by weeks or months, which means CMOs who wait for closed-won data to evaluate AI investments are always flying blind. These five leading indicators for AI marketing performance give you a read on whether the system is working long before a deal closes.
MQL-to-SQL Conversion Rate
Direction: increase. This measures whether AI-assisted lead scoring and content personalization are improving qualification quality, not just volume. According to Salesforce’s State of Marketing report, high-performing marketing teams are 2.8x more likely to use AI for lead scoring than underperformers (2024). If your MQL-to-SQL conversion rate stagnates after deploying AI scoring, the model is likely trained on the wrong intent signals.Speed-to-Lead
Direction: decrease. This is the elapsed time from a prospect’s first tracked touch to first sales contact. AI-driven routing and qualification should compress this to under five minutes for high-intent signals. The Harvard Business Review found that companies responding within one hour are 7x more likely to qualify the lead than those who wait even 60 more minutes. A rising speed-to-lead number signals that AI automation is not connected to your sales workflow.Sales Acceptance Rate (SAR)
Direction: increase. SAR is the percentage of marketing-passed leads that sales formally accepts. A low SAR, typically below 60%, signals that AI is optimizing for acquisition metrics rather than closed-deal characteristics. This is one of the fastest ways to detect a misaligned AI model.Win Rate by Channel
Direction: monitor by channel, not in aggregate. This tells you which AI-assisted acquisition channels produce deals that actually close, not just those that generate volume. A channel with a high MQL count but a sub-10% win rate is a cost center the AI is actively inflating.Experiment Velocity
Direction: increase. This is the number of marketing tests run per quarter. If you’re using AI-powered SEO platforms and content tools but your test count hasn’t increased, AI is being used for execution only. A stagnant experiment velocity is the operational fingerprint of a team that adopted AI tools without changing its decision-making process.
Pro Tip: Track these five metrics on a weekly cadence in a single shared view accessible to both marketing and sales leadership. Misalignment between SAR and MQL-to-SQL conversion rate is often the first visible sign that AI and human judgment are scoring leads against different definitions of “qualified.”
The five indicators above form the early-warning layer that sits beneath your revenue North Star, and they answer a question finance cannot: is AI changing how the pipeline is being built, or just how fast the same leads are being processed?
How Should CMOs Measure Brand Visibility Inside AI Search Results?
The pipeline-building question changes completely once you factor in a channel most marketing dashboards cannot see. When a B2B buyer asks ChatGPT, “What’s the best CRM for mid-market SaaS companies?” or queries Perplexity for vendor shortlists, your keyword rankings and organic traffic numbers are entirely irrelevant. The AI engine constructs an answer from its training data and cited sources, and your brand either appears in that answer or it does not. According to SparkToro’s 2024 zero-click research, nearly half of all searches now end without a click, and AI-generated answers accelerate that trend further, making brand visibility inside AI search performance metrics a first-order measurement problem for CMOs.
Five KPIs define this external AI visibility track:
AI Share of Voice (AI SoV): The percentage of AI-generated responses in your category that include a brand mention. Measure it manually by running 20-30 representative buyer prompts across ChatGPT, Perplexity, and Gemini each week, logging whether your brand appears. Tools like Otterly.AI ($29/mo starting) and Peec AI automate this at scale across six platforms simultaneously.
Competitive Citation Gap: Your AI SoV minus your top competitor’s AI SoV. A negative number is a boardroom-ready urgency signal. If you hold 18% AI SoV and a competitor holds 34%, the gap is minus 16 points and it is widening.
Persona-Based AI SoV: AI engines answer differently depending on how a question is framed. “Best CRM for a 50-person sales team” returns different results than “enterprise CRM with revenue intelligence.” Segment your prompt testing by buyer persona and use-case query type to understand where the brand is visible and where it is absent.
AI Citation Rate: How frequently your owned content or earned media appears as a named source inside AI responses. This is the Generative Engine Optimization equivalent of a backlink, and the best Perplexity rank tracking tools now track citation placement by domain.
Brand Sentiment in AI Answers: Qualitative monitoring of how AI describes your brand. Positive framing (“industry-leading data model”) versus neutral (“one option to consider”) versus negative (“some users report onboarding friction”) carries real commercial weight.
Important: Google Analytics surfaces some AI referral traffic under direct or “chatgpt.com” referral sources, but this severely undercounts AI-influenced demand. A buyer who reads a Perplexity answer and then types your URL directly into a browser never appears in your analytics as AI-sourced.
How to Turn AI Visibility Data Into a “Revenue at Risk” Number
Abstract citation metrics become executive-ready the moment you attach a dollar figure. The formula is straightforward:
Revenue at Risk = Monthly Category AI Query Volume x Estimated Conversion Rate x Average Deal Size x (1 – Your AI SoV)
For example: 10,000 monthly category queries, a 2% conversion rate, a $24,000 ACV, and a 15% AI SoV produces $4.9 million in annual revenue at risk from the 85% of AI responses that do not mention your brand.
If your Competitive Citation Gap is widening by 3 points per quarter, that revenue exposure is compounding. That reframe, from “we need better GEO” to “we are losing $4.9M in addressable AI-influenced pipeline,” is what earns CMO credibility with a CFO. Use AI vs traditional SEO tools benchmarks to estimate query volumes by category if your own data is thin.
The AI SoV number is the input your entire external measurement track feeds into, and the Revenue at Risk calculation is the output that justifies investing in improving it.
What Does a Two-Track AI KPI Scorecard Actually Look Like?
Both the Revenue at Risk calculation and the pipeline-per-hour North Star are only defensible when they sit inside a single, structured CMO measurement framework. The two-track AI KPI scorecard below consolidates every metric covered in this article into one reviewable system, separating internal GTM efficiency from external AI visibility so each metric is reviewed at the cadence that matches its signal speed.
| KPI Name | Track | What It Measures | Review Cadence |
|---|---|---|---|
| Pipeline per Marketing Dollar | Internal GTM | Revenue pipeline generated per $1 of marketing spend | Monthly |
| Pipeline per Marketing Hour | Internal GTM | Revenue pipeline generated per human-hour invested | Monthly |
| CAC Payback Period | Internal GTM | Months to recover cost of acquiring one customer | Quarterly |
| NRR Uplift | Internal GTM | Net revenue retention change attributable to AI-assisted programs | Quarterly |
| MQL-to-SQL Conversion Rate | Internal GTM | Lead quality and scoring model accuracy | Bi-weekly |
| Speed-to-Lead | Internal GTM | Minutes from form fill to first meaningful sales contact | Weekly |
| Win Rate | Internal GTM | Percentage of qualified opportunities closed won | Monthly |
| Experiment Velocity | Internal GTM | Number of AI-assisted marketing tests completed per sprint | Bi-weekly |
| AI Share of Voice | External AI Visibility | Brand mention rate across AI-generated answers in your category | Monthly |
| Competitive Citation Gap | External AI Visibility | Gap between your AI SoV and the nearest named competitor | Monthly |
| Persona-Based AI SoV | External AI Visibility | AI SoV segmented by buyer persona or job title prompt type | Quarterly |
| AI Citation Rate | External AI Visibility | Percentage of tracked AI queries that cite your owned content | Monthly |
| Revenue at Risk | External AI Visibility | Pipeline dollar value exposed to AI SoV shortfalls | Quarterly |
| Brand Sentiment in AI Answers | External AI Visibility | Qualitative tone of brand mentions in AI-generated responses | Monthly |
Tracking AI search visibility alongside your semantic SEO signals ensures the external track reflects how AI engines are actually constructing answers, not just who ranks on page one.
The Measurement-Confidence Layer
Every number in the table above is only as credible as the data underneath it. According to Gartner’s 2024 Marketing Data and Analytics Survey, 54% of marketing decisions are made with data leaders themselves describe as “low quality.” That statistic will surface in your next board presentation if you skip this layer.
The measurement-confidence layer has three components: CRM/MAP field integrity (what percentage of contact, account, and opportunity records have the required fields populated), data completeness score (a single aggregate figure tracking whether AI attribution inputs are present across your pipeline), and AI content governance rate (the percentage of AI-generated content that has passed human review and approval before publication). Without a governance rate above 80%, CFOs will correctly challenge whether your AI citation rate reflects deliberate brand positioning or unreviewed content drift. Tools that automate AI content quality audits can accelerate this process, but the governance threshold itself must be a board-approved policy, not a marketing team assumption.
Important: Present all three confidence-layer metrics alongside the main scorecard in every C-suite review. A strong AI Share of Voice number reported against a 60% CRM field integrity score will generate more skepticism than confidence.
The two-track scorecard only earns executive trust when the measurement-confidence layer proves the underlying data is clean enough to act on.
How Do You Build C-Suite Confidence in AI Metrics When Attribution Is Noisy?
Clean data architecture earns executive trust faster than any narrative. CFOs and boards will probe AI attribution ambiguity the moment pipeline numbers look different from last quarter, which means the measurement-confidence layer cannot be bolted on after the reporting season starts. It must be built into your operating model from day one.
Follow these four steps to convert skepticism into alignment:
Baseline before you instrument. Run a 90-day pre-AI measurement window for your North Star and leading indicators before deploying any new tool or workflow. Without a credible baseline, every improvement looks like noise. Finance cannot accept a trend line that starts the day you started measuring it.
Reconcile AI attribution with finance first. Agree with your CFO on a pipeline attribution methodology before Q1 reporting, specifically whether marketing-sourced and marketing-influenced pipeline use last-touch, multi-touch, or a negotiated blended model. CFO marketing alignment on methodology eliminates the single biggest source of board-room friction around AI ROI claims.
Report a measurement-confidence score alongside every metric. Explicitly tag each KPI with a data-completeness percentage, for example, “Pipeline-per-hour: 84% complete, based on 9 of 11 integrated sources.” According to MIT Sloan Management Review, organizations that treat KPI accountability as a governance imperative, not just a performance metric, consistently outperform peers on strategic execution. Showing the confidence score signals discipline, not weakness.
Lock in a 30-day KPI operating rhythm. Weekly reviews cover leading indicators where signal moves fast. Monthly reviews assess your North Star. Quarterly scorecard presentations go to the board with full context. The 30-day KPI operating rhythm prevents one bad week from triggering strategic pivots and one strong quarter from hiding systemic drift.
Pro Tip: Advanced marketing teams now use tools like ChatGPT to stress-test KPI definitions before they hit the CFO’s desk. Prompting the model to “find the attribution loopholes in this pipeline metric” surfaces objections your board will raise, weeks before they raise them. KPI design is becoming a strategic capability, not an ops afterthought.
Tracking SEO ranking reporting tools alongside your AI visibility metrics makes the confidence-scoring exercise faster because the data pipeline is already instrumented.
The CMO who shows up with a confidence-scored, finance-reconciled scorecard wins the C-suite argument before attribution gets noisy.
The One CMO Metric Hiding in Plain Sight: Marketing-Adjusted NRR
Winning the C-suite argument on attribution is only half the battle. The CMO who wants a permanent seat at the revenue table needs a metric that extends ownership beyond the first deal, and most are leaving the most defensible one entirely on the table.
Net Revenue Retention (NRR) measures the percentage of recurring revenue retained from existing customers over a period, including expansion, contraction, and churn. Most CMOs treat it as someone else’s number: a CS metric, a product metric, something reviewed in a QBR that marketing neither owns nor influences. That assumption is increasingly wrong, and increasingly expensive.
Here is the core insight: when marketing runs post-sale onboarding content, AI-personalized re-engagement sequences, expansion campaigns, and community programs, it directly influences whether customers renew, expand, or churn. The problem has never been that marketing’s contribution to retention doesn’t exist. The problem is that no one tagged the touchpoints, so no one could measure the delta.
Marketing-Adjusted NRR is the measurable difference in Net Revenue Retention between accounts that engaged with marketing-owned post-sale touchpoints and those that did not. According to Gainsight’s 2024 Customer Success Index, companies with coordinated marketing and CS post-sale motions report NRR that is 8 to 12 percentage points higher than those running them in siloes.
The methodology is straightforward:
- Tag all post-sale marketing touchpoints (onboarding emails, expansion nurture sequences, webinars, AI-personalized re-engagement) in your CRM or MAP
- Segment accounts by touchpoint engagement level: high, low, none
- Compare 12-month NRR across each cohort
- Report the delta as Marketing-Adjusted NRR in your board deck
Pro Tip: AI personalization tools now make this segmentation scalable across thousands of accounts. What previously required a dedicated lifecycle team can run as an automated, tagged motion, making the attribution defensible rather than directional.
In a market where customer acquisition costs have risen over 60% in the past five years, new logo growth alone cannot sustain a SaaS GTM model. The CMO who can demonstrate that marketing-owned touchpoints lifted NRR by even 5 percentage points is no longer a campaign manager. That CMO is a measurable driver of expansion revenue, customer lifetime value, and ultimately, company valuation.
That is the metric that earns the seat no one can argue you out of.
Last updated: 2026-05-07
Frequently Asked Questions
What metrics should I track to measure AI’s impact on marketing?
Start with a pipeline influenced by AI-generated content, lead quality scores from AI-assisted targeting, and time-to-conversion compared to non-AI campaigns. You should also track operational metrics like content production velocity and cost-per-asset to capture efficiency gains alongside revenue outcomes.
What are the KPIs used to evaluate AI performance in marketing?
AI marketing KPIs fall into two categories: efficiency metrics (content output per team member, campaign setup time, cost-per-lead) and effectiveness metrics (conversion rates, pipeline contribution, and customer acquisition cost). The most useful scorecards track both simultaneously so you can see whether AI is saving money, generating revenue, or ideally doing both.
How is AI changing the way CMOs measure marketing success?
AI is shifting measurement from last-click attribution toward influence-based models that track how multiple touchpoints contribute to a decision over time. CMOs are also adding new categories entirely, such as brand visibility inside AI-generated search answers, which did not exist as a measurable channel just a few years ago.
What is a good North Star KPI for AI-driven marketing?
A strong North Star KPI connects AI activity directly to revenue quality, not just volume. Revenue per marketing-qualified lead or pipeline-to-close rate tends to work well because it reflects whether AI is attracting the right buyers, not just more buyers.
How do you measure brand visibility in AI search results like ChatGPT or Google Gemini?
Tracking AI search visibility requires monitoring how often your brand appears in AI-generated answers across tools like ChatGPT, Perplexity, and Google’s AI Overviews for your target queries. Share of voice in AI results, citation frequency, and source attribution are the emerging metrics most relevant to this channel.
Why is Net Revenue Retention (NRR) relevant to the CMO role?
NRR measures how much revenue expands or contracts within your existing customer base, and marketing directly influences it through onboarding content, product education, and upsell campaigns. When CMOs track and report on NRR alongside acquisition metrics, they demonstrate full-funnel accountability rather than handing off responsibility at the point of sale.
How do you present AI marketing metrics to a skeptical CFO or CEO?
Lead with business outcomes first, such as pipeline growth or reduced customer acquisition cost, and use AI-specific metrics only as supporting evidence for why those outcomes improved. Pairing a financial result with a clear operational cause, for example faster content production leading to more touchpoints in less time, builds credibility without requiring executives to trust the AI metrics on their own.
Conclusion
The measurement frameworks that carried marketing leaders through the last decade will not survive contact with an AI-driven GTM environment. If there is one principle worth anchoring to from this guide, it is the two-track imperative: you need internal AI efficiency metrics like pipeline per marketing hour, CAC payback, and Marketing-Adjusted NRR running in parallel with external AI visibility metrics like AI Share of Voice and Competitive Citation Gap. Neither track alone tells the full story.
Equally important, your CFO and board will not trust numbers they cannot trace. Data completeness and CRM field integrity are not back-office hygiene tasks. They are the foundation of measurement confidence, and without them, even the right KPIs lose credibility in the room.
The CMO’s guide to AI metrics raises a clear question: what KPIs actually matter? The answer starts with action, not analysis paralysis.
Your next step is concrete: open your current marketing dashboard this week, flag every metric that measures activity over outcomes, and instrument at least one leading indicator from each layer covered here. Thirty days is enough time to see whether your measurement system is built for 2026 or still wired for 2019.