Pages that load in 1 second convert 3x better than pages taking 5 seconds, according to Portent research, which makes running a proper website speed audit one of the highest-ROI tasks in your entire optimization workflow. A website speed audit is a complete evaluation of how fast your site loads, how it performs across devices, which metrics are failing, and which specific issues are slowing it down, so you can fix them in order of impact. Tools like Google PageSpeed Insights, GTmetrix, and WebPageTest make it possible to surface those issues in minutes.
Table of Contents
- What Is a Website Speed Audit (and Why Does It Matter for SEO)?
- What Should You Measure? The Key Metrics in a Speed Audit
- Lab Data vs. Field Data: Why Your Audit Needs Both
- Step-by-Step: How to Run a Website Speed Audit Using Free Tools
- Which Pages Should You Audit First?
- How to Interpret Your Speed Audit Results and Prioritize Fixes
- The Hidden Speed Killers Most Audits Miss: Third-Party Scripts and Real-User Variance
- Frequently Asked Questions
- How often should I run a website speed audit?
- What is a good website speed score?
- Does website speed directly affect Google rankings?
- Is Google PageSpeed Insights the most accurate speed testing tool?
- Why does my website score differently on different speed testing tools?
- Can a slow website hurt my conversion rate, not just my SEO?
- What is the difference between lab data and field data in a speed audit?
- Conclusion
The urgency around site performance has only intensified heading into 2026. Google’s Core Web Vitals are confirmed ranking signals, and in March 2024, Interaction to Next Paint (INP) officially replaced First Input Delay (FID) as a Core Web Vital, raising the bar for what “good” performance actually means. Sites that haven’t audited their performance since early 2024 may already be ranking faster competitors below without knowing why.
The good news: you don’t need a developer or an enterprise budget to run a thorough audit. Free tools cover 90% of what most sites need, and the process follows a repeatable, step-by-step framework that turns raw diagnostic data into a prioritized fix list.
TL;DR: A website speed audit is a systematic evaluation of your site’s loading performance, and it directly impacts both user experience and SEO rankings. The process focuses on Core Web Vitals metrics and requires cross-referencing lab data with real-user field data to get an accurate picture of how your site actually performs. Rather than chasing a high score in tools like GTmetrix or PageSpeed Insights, the priority should be fixing real performance problems, particularly hidden speed killers like third-party scripts that most audits overlook. Setting up continuous performance monitoring, not just one-time tests, ensures your site stays fast as it evolves.
Key Takeaways
- A website speed audit goes beyond a single score by identifying specific metrics, diagnosing root causes, and producing a prioritized list of fixes tied to real user impact and SEO outcomes.
- Focus on Google’s Core Web Vitals framework, which defines six metrics covering loading speed, interactivity, and visual stability, rather than chasing an overall letter grade from tools like GTmetrix or PageSpeed Insights.
- A page scoring 74 can load faster in practice than one scoring 91, so prioritize fixing actual performance problems measured in field data, not improving a vanity score in lab conditions.
- Third-party scripts are a commonly overlooked speed killer, as they introduce loading delays that standard lab-based audits miss because tests run under controlled, single-device conditions that don’t reflect real-user variance.
- Cross-reference lab data with real-user field data during your audit workflow, moving from broad scoring to granular diagnostics to production validation for the most accurate performance picture.
- Set up continuous performance monitoring after your initial audit, since one-time tests cannot capture regressions introduced by new code deployments, plugin updates, or shifting third-party script behavior over time.
What Is a Website Speed Audit (and Why Does It Matter for SEO)?
A website speed audit is a systematic evaluation of a website’s loading performance that identifies specific metrics, diagnoses root causes of slowdowns, and produces a prioritized list of fixes. It goes beyond a single speed score to measure how real users experience your pages across devices and network conditions.
That distinction matters more than most site owners realize. A one-time speed test captures a single URL snapshot at a single moment. A full site performance evaluation examines LCP, INP, and CLS across multiple pages, correlates lab data with real-user field data, and surfaces the underlying causes — not just the symptoms.
Page speed is a confirmed Google ranking signal. According to Google’s own research, 53% of mobile users abandon a page that takes longer than 3 seconds to load (Think with Google, 2023). For e-commerce sites, that abandonment translates directly to lost revenue, not just lost rankings.
Google’s Core Web Vitals framework defines the three metrics that carry the most weight in page experience scoring:
- LCP (Largest Contentful Paint): how fast the main content loads (target: under 2.5 seconds)
- INP (Interaction to Next Paint): how quickly the page responds to user input (target: under 200ms)
- CLS (Cumulative Layout Shift): visual stability as the page loads (target: under 0.1)
One critical update many auditors are still missing: INP permanently replaced FID (First Input Delay) as a Core Web Vital in March 2024. If your current audit workflow still flags FID as a primary metric, you are measuring a metric Google no longer uses for ranking.
A thorough speed audit connects directly to technical SEO performance and feeds into broader site health strategies that affect everything from crawl budget to conversion rates.
Important: Passing Core Web Vitals in a lab tool like PageSpeed Insights does not guarantee a “Good” rating in Google Search Console. Field data from real users often tells a very different story than lab simulations.
The most useful speed audits treat Core Web Vitals scores as the starting point, not the finish line.
What Should You Measure? The Key Metrics in a Speed Audit
Knowing which numbers to track separates a productive audit from a fruitless one. Google’s Core Web Vitals framework defines six metrics that collectively capture loading speed, interactivity, and visual stability. Each has a published threshold that distinguishes “good” from “needs improvement” from “poor.”
| Metric | What It Measures | Good Threshold | Poor Threshold |
|---|---|---|---|
| Largest Contentful Paint (LCP) | Loading performance: when the main content loads | Under 2.5s | Over 4.0s |
| Interaction to Next Paint (INP) | Responsiveness: delay between input and visual response | Under 200ms | Over 500ms |
| Cumulative Layout Shift (CLS) | Visual stability: unexpected layout movement during load | Under 0.1 | Over 0.25 |
| Time to First Byte (TTFB) | Server response speed: time until first byte received | Under 800ms | Over 1,800ms |
| First Contentful Paint (FCP) | First visible content rendered in the browser | Under 1.8s | Over 3.0s |
| Total Blocking Time (TBT) | Main thread blockage: lab-based proxy for INP | Under 200ms | Over 600ms |
A few critical context points for each metric:
- INP replaced First Input Delay (FID) as an official Core Web Vital in March 2024, making it the primary responsiveness signal Google uses for ranking
- TBT is lab-only. It does not appear in field data but strongly correlates with INP, making it your primary diagnostic lever during testing
- CLS is particularly brutal for ecommerce sites; a score above 0.1 typically signals unspecified image dimensions or late-loading ad slots
- According to Google Search Central, pages that pass all three Core Web Vital thresholds (LCP, INP, CLS) receive a ranking signal benefit (2023)
Lab Data vs. Field Data: Why Your Audit Needs Both
Lab tools like Lighthouse generate reproducible, diagnosable results under controlled conditions. Field data from the Chrome User Experience Report (CrUX) captures how actual users experience your pages across real devices, networks, and geographies.
The gap between the two can be dramatic. A page may score 92 in PageSpeed Insights lab mode while failing LCP in field data because 40% of its real users are on throttled mobile connections. Audits that rely on lab data alone routinely miss this.
Important: CrUX data requires sufficient traffic to populate. Low-traffic pages may show no field data at all, making lab results your only available signal. Factor this into how you interpret results.
Both data types are essential for accurate decisions. Lab data tells you what to fix; field data tells you whether the fix actually helped real users. Understanding this distinction also matters for technical SEO performance, where real-user metrics directly influence search visibility.
Key differentiator: A site can pass every lab test and still fail Core Web Vitals in production. Always cross-reference CrUX field data before closing any speed audit.
Step-by-Step: How to Run a Website Speed Audit Using Free Tools
Cross-referencing lab data against real-user field data is exactly what this workflow builds toward. The five steps below mirror a professional audit sequence, moving from broad scoring to granular diagnostics to production validation.
Step 1: Start with Google PageSpeed Insights
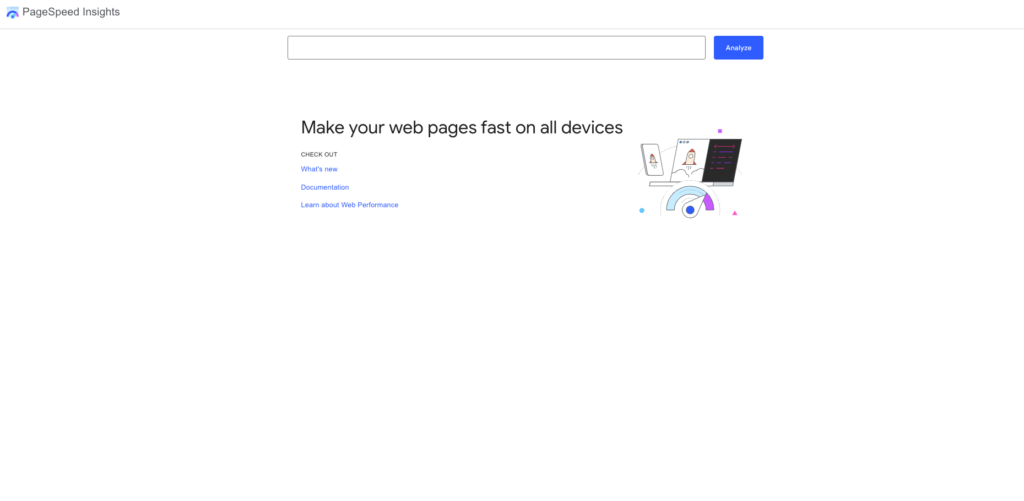
Go to pagespeed.web.dev and enter your URL. Run both mobile and desktop analyses. The critical distinction here: scroll past the lab score (the big colored circle) to the Field Data section, which pulls from Google’s Chrome User Experience Report (CrUX). Field data reflects what real users on real networks actually experienced. A lab score of 90 means nothing if your LCP field data reads “Poor” for 45% of your visitors.
Step 2: Run a waterfall analysis in GTmetrix
GTmetrix generates a request waterfall that maps every resource your page loads, including images, scripts, fonts, and third-party embeds, in chronological order. The filmstrip view is especially revealing: it shows exactly what users see at the 1-second, 2-second, and 3-second marks. A render-blocking JavaScript file loading at 800ms before any content appears will show up immediately here. According to Google’s research, pages that load in under 1 second have a conversion rate 3x higher than pages taking 5 seconds (Google/SOASTA, 2017).
Step 3: Test from multiple global locations
A fast score from a US-East server can mask serious latency for visitors in Europe, Southeast Asia, or South America. Both GTmetrix and Pingdom Tools offer location selection. Run the same URL from at least three geographic regions and compare TTFB values. A TTFB above 600ms in any region signals a CDN gap or origin server bottleneck.
Step 4: Stress-test with DebugBear or WebPageTest
For deeper diagnostics, DebugBear and WebPageTest expose render-blocking resources, per-origin TTFB breakdowns, and third-party script timelines that GTmetrix doesn’t surface as clearly. WebPageTest’s “Opportunities & Experiments” tab lets you simulate blocking specific third-party scripts to quantify their exact performance cost.
Step 5: Cross-reference with Google Search Console
Open Search Console and navigate to Experience > Core Web Vitals. This report flags which URLs are failing in production using the same CrUX field data that influences Google’s ranking signals. A URL flagged here is a confirmed ranking liability, not just a lab hypothesis.
Important: Google uses mobile-first indexing for all sites. Always run Step 1 on mobile before checking desktop. A desktop score of 95 paired with a mobile score of 42 is a mobile-first indexing problem that affects how the entire site ranks.
Which Pages Should You Audit First?
Auditing only your homepage is the most common speed audit mistake. Product pages, blog posts with heavy images, and campaign landing pages routinely perform 30-50% worse than homepages because they carry more third-party scripts and unoptimized media.
Use Google Search Console or Google Analytics to pull your top 10 pages by organic traffic. Prioritize:
- Homepage (first impression, crawl entry point)
- Top 3-5 organic landing pages (highest SEO exposure)
- Product or service pages (conversion impact)
- Any page with video embeds or large image galleries
Pro Tip: If you’re also tracking how your site performs in AI-powered search results, pair your speed audit with SEO ranking reporting tools that surface both Core Web Vitals data and visibility metrics in a single dashboard.
A properly scoped audit tests 5-7 representative pages minimum. Speed performance is not uniform across a site, and a single-page snapshot will consistently under-report real performance problems.
How to Interpret Your Speed Audit Results and Prioritize Fixes
Most developers make the same mistake: they fix the score, not the problem. The overall grade in GTmetrix or PageSpeed Insights is a vanity metric. A page can score 74 and load faster in practice than a page scored 91. Focus exclusively on the specific failing diagnostics listed under each report’s “Opportunities” and “Diagnostics” sections.
Work through fixes in this order, matched to their SEO weight:
Step 1: Fix LCP first. Largest Contentful Paint carries the heaviest weighting among Core Web Vitals for search ranking signals. According to Google’s Web Almanac 2024, only 43% of origins pass the LCP threshold of 2.5 seconds. Common culprits and their fixes:
- Unoptimized hero images: Compress to WebP/AVIF and add a
<link rel="preload">tag for the LCP image resource - Render-blocking CSS/JS: Move critical CSS inline and defer non-critical JavaScript using the
deferorasyncattribute - Slow TTFB: Upgrade hosting, add a CDN, or enable server-side caching to get response time under 600ms
Step 2: Resolve CLS. Cumulative Layout Shift problems are almost always structural. Set explicit width and height attributes on all images and iframes. Reserve space for dynamically injected banners and ads. For web fonts causing late layout shifts, add font-display: swap and preload the primary font file.
Step 3: Address INP last. Interaction to Next Paint failures trace back to heavy JavaScript execution blocking the main thread on click or tap. The fix: break up long tasks using setTimeout chunking, reducing third-party script load, and deferring non-critical event listeners.
Pro Tip: Before writing a single line of code, audit your Lighthouse recommendations using the “Estimated Savings” column. Fixes showing 500ms+ savings should move to the top of your sprint backlog regardless of category.
Prioritize by effort-to-impact ratio:
| Fix | Impact | Effort |
|---|---|---|
| Image compression + WebP conversion | High | Low |
| Preload LCP image resource | High | Low |
| Defer non-critical JavaScript | High | Low-Medium |
| Remove or delay third-party scripts | High | Medium |
| Server/hosting upgrade | High | High |
| CLS dimension fixes | Medium | Low |
Since page speed is also a direct input into technical SEO performance, every fix you ship compounds: faster pages earn better crawl budgets, lower bounce rates, and stronger Core Web Vitals field scores over the 28-day CrUX collection window.
Key differentiator: Treat LCP, CLS, and INP as three separate workstreams with separate owners. Bundling them into one sprint delays every fix and obscures which change actually moved the needle.
The Hidden Speed Killers Most Audits Miss: Third-Party Scripts and Real-User Variance
Most speed audits answer the wrong question. They measure how a site performs under lab conditions on a single simulated device, then declare the job done. Two blind spots consistently slip through: third-party script drag and real-user device variance.
Third-party scripts are the most underreported source of latency on modern websites. Chat widgets, ad network tags, cookie consent banners, social embeds, and analytics pixels can each add 200-800ms to page load time, yet a basic PageSpeed Insights scan often attributes that cost to vague “render-blocking resources” without naming the vendor. According to HTTP Archive’s Web Almanac, third-party requests account for roughly 45% of all requests on the median webpage (2022).
To isolate this drag precisely, use two techniques:
- WebPageTest’s block feature: Enter specific third-party domains in the “Block” field, then run comparative tests with and without them. The waterfall difference is your measurable tax per vendor.
- GTmetrix waterfall analysis: Filter the waterfall chart by domain to see exactly which external hosts are creating request chains, long waiting times (TTFB per asset), or late-loading render blocks.
Auditing with and without third-party scripts converts a vague suspicion into a defensible cost-per-vendor number that justifies removal or lazy-loading to stakeholders.
The second blind spot is real-user variance by device and connection. Lab tools test from a single fixed connection. Real users on 4G in rural areas or older Android handsets may experience load times 3-5x slower than your lab result. This is not hypothetical. PageSpeed Insights surfaces CrUX field data segmented by phone, tablet, and desktop, showing actual 75th-percentile Core Web Vitals from your real visitor pool, not a simulated Moto G4.
Pro Tip: If your CrUX phone data shows a “Poor” LCP while your desktop lab score shows “Good,” your audit isn’t finished. Fix the metric that affects the majority of your actual traffic first.
This reframes a speed audit from a technical checkbox into a user-experience question: how does your site perform for your users, on their devices? That framing, combined with solid technical SEO foundations, is what converts audit findings into measurable ranking and conversion gains.
Last updated: 2026-05-07
Frequently Asked Questions
How often should I run a website speed audit?
Run a full speed audit at minimum once per quarter, but also after any major site changes such as a new theme, plugin installation, or redesign. If you have continuous monitoring set up, you can catch regressions automatically rather than relying solely on scheduled audits.
What is a good website speed score?
A score of 90 or above in tools like Google PageSpeed Insights is generally considered good, but the score itself matters less than your Core Web Vitals passing thresholds. Focus on achieving a Largest Contentful Paint under 2.5 seconds, a Cumulative Layout Shift below 0.1, and an Interaction to Next Paint under 200 milliseconds.
Does website speed directly affect Google rankings?
Yes, Google has confirmed page experience signals, including Core Web Vitals, are used as ranking factors. While speed is not the single most important ranking factor, a slow site can suppress your rankings and increase bounce rates, which indirectly harms your overall SEO performance.
Is Google PageSpeed Insights the most accurate speed testing tool?
Google PageSpeed Insights is valuable because it reflects how Google evaluates your pages, but it measures a single point in time and a single location. Using it alongside tools like WebPageTest or GTmetrix gives you a more complete picture, especially for testing from multiple geographic regions.
Why does my website score differently on different speed testing tools?
Each tool uses different server locations, browsers, connection speeds, and scoring algorithms, so variation between tools is completely normal. Rather than chasing a perfect score on one tool, look for consistent patterns and recurring recommendations across multiple platforms.
Can a slow website hurt my conversion rate, not just my SEO?
Absolutely. Studies consistently show that even a one-second delay in page load time can reduce conversions by 7 percent or more, meaning slow sites lose revenue directly in addition to losing organic traffic. Speed improvements often deliver measurable business results well beyond search rankings.
What is the difference between lab data and field data in a speed audit?
Lab data is collected in a controlled environment using simulated conditions, while field data, also known as real user monitoring data, reflects actual experiences from real visitors on their own devices and connections. Field data is generally more reliable for understanding true user experience, but lab data is more useful for diagnosing and reproducing specific performance issues.
Conclusion
A website speed audit is not a one-time checkbox. It is an ongoing practice that separates sites that consistently rank and convert from those that quietly bleed traffic after every update, plugin addition, or new third-party script.
The single most important mindset shift from this guide is this: treat performance monitoring as a continuous process, not a project. Focus on LCP first, since improving it tends to deliver the most visible SEO and user experience gains. Even shaving 500ms from your load time can compound into measurable improvements in rankings and conversions over time.
Watch out for the hidden speed killers, too. Third-party scripts and real-user variance rarely show up in a single lab test, which is exactly why ongoing monitoring matters more than any snapshot result.
Your next step is simple and free: run your first audit right now using Google PageSpeed Insights, document your baseline scores, and then set up a weekly monitoring schedule in GTmetrix to catch regressions before they damage your rankings. That one habit puts you ahead of most of your competitors.